
By SLCgreen Interns Frances Benfell, Emma Johnson, and staff Jude Westwood
When my friend Tia made plans to spend the weekend in Salt Lake City, she didn’t know what she was in for. A few days before her visit, I texted her and asked, “How do you feel about waking up at 5:30 am to go heat mapping with me on Saturday?” She responded, “I don’t know what that is, but as long as you buy me coffee!”
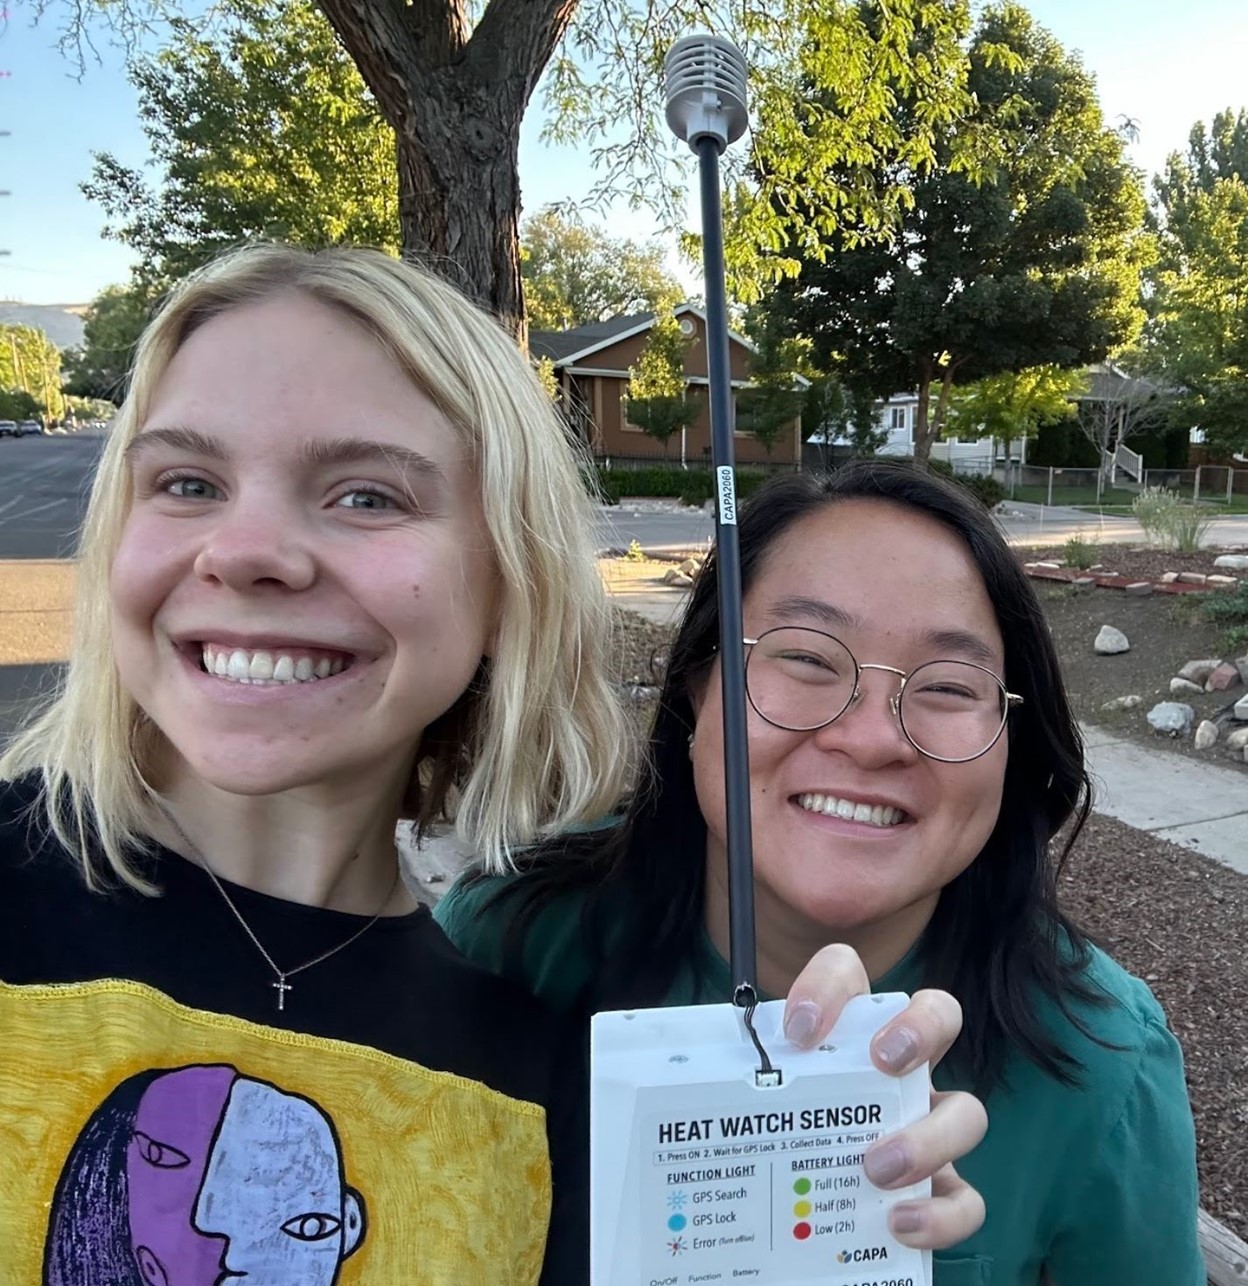
As we drove to pick up our heat sensor on a Friday afternoon in mid-July, I explained the project to Tia. We were volunteering to drive one of ten routes across Salt Lake City with a sensor attached to our car that would measure temperature, humidity, and location along the way. Our role (along with over 40 other volunteers) was to gather data for a citizen science research project funded by the National Oceanic and Atmospheric Administration (NOAA). Salt Lake City was one of 18 communities chosen to participate in this year’s mapping project. Over 60 communities have participated since the program started in 2017.
NOAA partners with CAPA Strategies, a contractor that administers the program from start to finish. CAPA processes the sensor readings we gathered to create a map of real-world temperature data that will provide a granular understanding of extreme heat in Salt Lake City.
SEE THE SALT LAKE CITY HEAT MAPPING RESULTS HERE. (or see PDF of SLC heat mapping results)
Urban Heat Islands
Believe it or not, temperatures can vary 15 to 20 degrees Fahrenheit across a city depending on several factors, including the concentration of heat-absorbing surfaces, heat-emitting devices, and tree canopy coverage. These differences in heat aren’t coincidental either. Often the hottest areas of a city are those that have been historically redlined and under-invested in. Extreme heat is not only a public health concern but an equity issue as well.
Drive Time
Starting precisely at 6 am, Tia and I began our route in synchrony with ten other pairs of volunteers across the city. I made my way past Liberty Park, through the shady avenues of Yalecrest, up towards Hogle Zoo, and back down again in a loop. Tia navigated to make sure we were following the pre-determined route. The route was not straightforward, often going through neighborhoods rather than thoroughfares. That’s because each route was designed to pass by ‘points of interest,’ such as areas where people congregate outdoors, transit centers, schools, or areas with very high or very low tree canopy cover.

Tia and I were part of the first-round mapping effort from 6–7 am. Mapping early in the day helped benchmark how much temperatures drop overnight in Salt Lake City. In urban areas, heat-absorbing surfaces like pavements and roofs radiate heat at night, keeping air temperatures elevated. The same routes were mapped again between 3–4 pm, documenting peak temperatures during the day. And finally, the routes were mapped between 7–8 pm to get a benchmark of evening temperatures.

It Takes a Village
The heat mapping process is standardized, but it also took a wealth of local insight and community involvement to make it successful. Citizen volunteers like Tia and I were on the ground gathering data. And even though Wei Zhang, a climate researcher at USU, led the project, he engaged a range of community organizations for support. Organizations including Salt Lake City, Rowland Hall School, HEAL Utah, Tree Utah, and the Natural History Museum all participated in designing the routes, recruiting volunteers, and assisting in communications.
Rob Wilson, a science teacher and coordinator of Climate Studies at Rowland Hall, went above and beyond, taking on responsibility for coordinating and training volunteers for the campaign day.
See the heat mapping results here.
We see this research as a step forward in an ongoing effort towards building a more climate-resilient and equitable Salt Lake City.
Why is Heat Mapping Important?
Have you ever gotten heat exhaustion before? Maybe you got dehydrated on a hike or while doing yard work. You may have started out feeling thirsty, developed a headache, and then become lightheaded. In the best-case scenario, you have access to a cool place and hydrating fluids. However, some people don’t have the resources address heat exposure in time.
Extreme heat is the leading weather-related killer in the United States. People who work outdoors during the day, don’t have access to air conditioning, or are experiencing homeless are all vulnerable during heat waves. Children, elderly individuals, and those with pre-existing health conditions are also at high risk.

As summers become more intense and heat waves become more frequent, gathering heat data is essential for protecting public health and promoting heat equity.
In a recent conversation between SLCgreen staff and Victoria Ludwig, Manager of the EPA’s Heat Island Reduction Program, Ludwig emphasized the importance of having heat mapping data. In a world of competing financial priorities, heat mapping data is persuasive. It helps groups secure funds for heat mitigation projects and can save lives.
So, What’s Next?
In the short term, it’s essential to have resources for those most vulnerable to extreme heat. Salt Lake County operates ‘Cool Zones’ at libraries and community centers across the city. These are designated spaces open to the public and free of charge where individuals can cool off and hydrate.
In the long term, increasing tree canopies and vegetation in our city is vital. Mayor Erin Mendenhall has already started an initiative to plant 1,000 trees on Salt Lake City’s west side every year she is in office. Salt Lake City is also working on integrating green space into city streets with the Green Loop project and other parks enhancements.
Wondering What You Can Do?
Individual residents can help keep the city cooler by being mindful of their landscaping. Not all water-conscious yards are created equally. Replacing your grass with mulch and drought-tolerant native plants is better than putting in a rock garden or Astro Turf (both of which absorb a lot of heat).
Also, consider adopting a tree in a park strip near you. The city is planting trees, but those trees need water to grow!
Vegetation isn’t the only solution either. We need to reduce the amount of heat-absorbing surfaces in the city too. If you own your home, consider installing a ‘Cool Roof’ which reflects heat rather than absorbing it. A cool roof can save you money on energy costs while also contributing to a cooler city overall.
If you’re interested in learning more about the heat-mapping campaign, check out these news articles:
KUER One Good Thing About the heat wave? It Let Salt Lake City Map Urban Heat Islands
KSL Heat Waves are Getting Worse
Fox 13 Volunteers help create heat map